

This post is also available in:
![]() Português
Português
CIMETRICS where to start?
CIMETRICS is one of the most useful tools in combination with TELEGRAM. You can use Binance to scan the markets for trading signals. Its engine is designed to help traders increase their trading abilities. It does this by identifying trading opportunities in the cryptocurrency markets. Using both simple and complex sets of matrices to measure real-time price movements.
Initially, the site states it was built for personal purposes. By a group of experienced traders to monitor the market for their own specific needs. As the popularity of this segment of the market expanded. They also made their tools/tech available to other traders through Telegram.
Table of Contents (click to expand)

Where & Why?
Cimetrics various bots collect data from Binance API's. From there, it sends that data to different Telegram channels through their bots. Since Telegram is a very popular platform, especially among traders and signal providers, it is a perfect place for many to use these tools.
Binance – It's the top exchange for trading crypto and altcoins throughout the globe, as they state on their homepage, which you can find here at –>”CIMETRICS“
Telegram – Likely the most popular messaging platform for crypto traders ever invented worldwide. In addition, it is reliable and interoperable with various data providers, making it easy to use. It also works on just about all platforms with ease. You can see our list of the best Telegram Crypto Signals Channels.
CIMETRICS ENDPOINT BOTS
CIMETRICS keeps referring to their Bots as ENDPOINTS. Which is just programmer speak for their final output from the data they collect. Then disperse in their channels. It is terribly silly for them to use such a nomenclature, but whatever. So when you see them mentioning ENDPOINTS, just know they mean their Bots.
First, let's take a look at the 7 different bots and what each one offers end users through CIMENTRICS. Note that each of these bots performs a specific collection of data that tells you different things. I Kind of think of them as indicators with numbers instead of just graphically represented data. Below, we go through each of the 7 different cryptocurrency trading bots. In this analysis, we will also highlight the best crypto trading bots for beginners, ensuring that new users find tools tailored to their experience level. These bots are designed to simplify the trading process, making it more accessible and less intimidating for those just starting out in the cryptocurrency market. Additionally, we will provide insights into their features and functionalities to help you make informed choices.
BOOM
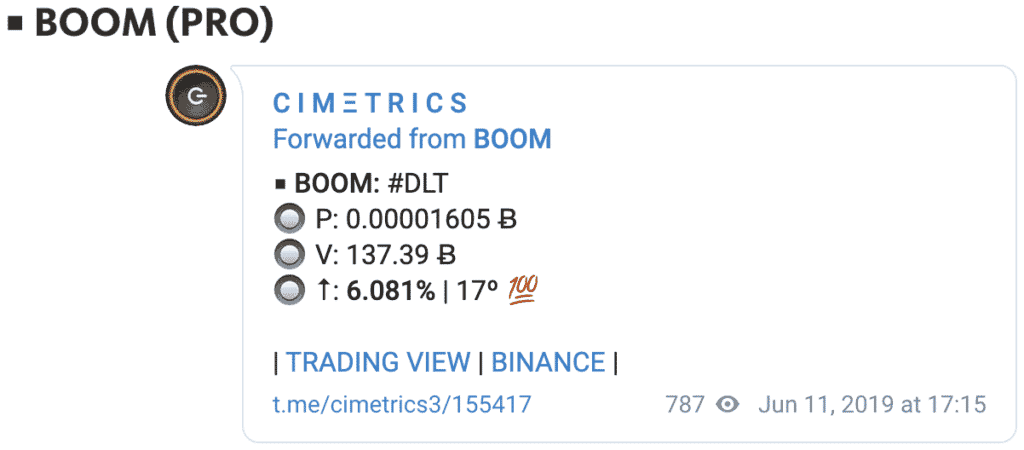
Here we can see CIMETRICS first bot called BOOM. I myself like Boom the most because it simply shows the Price/Volume and % movement. Doing so in its scale metrics. along with the number of alerts generated per pair. In the above example, the 100 means that all the metrics were hit and is likely a very strong move.
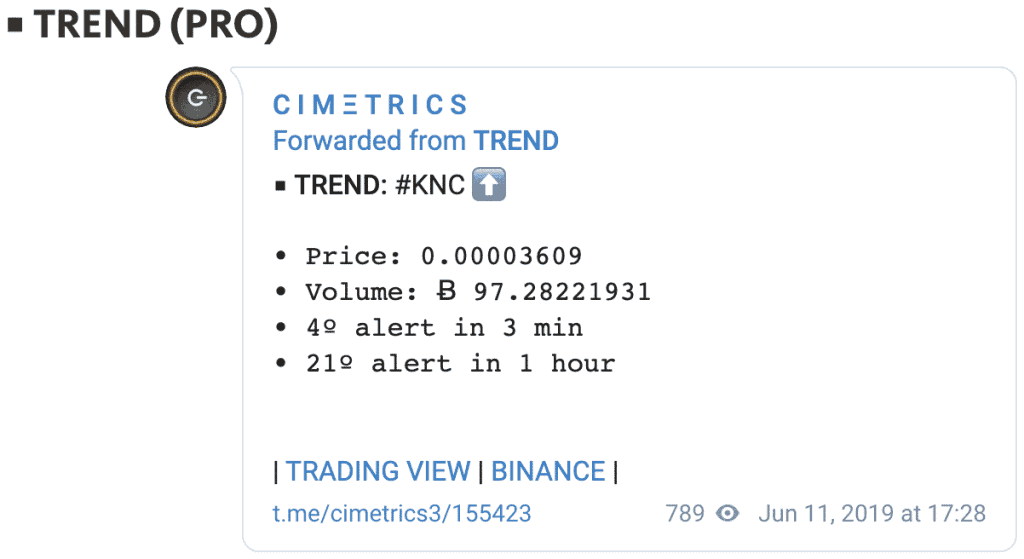
TREND
With TREND likely my least favorite of the tools. Because imo you are better off noting this in the charts rather than as a signal. But again that is my own personal opinion. I do know a few people that like this tool because well they are nerds. They even still use DOS from the f-ing 80s! So I have no comment on that.
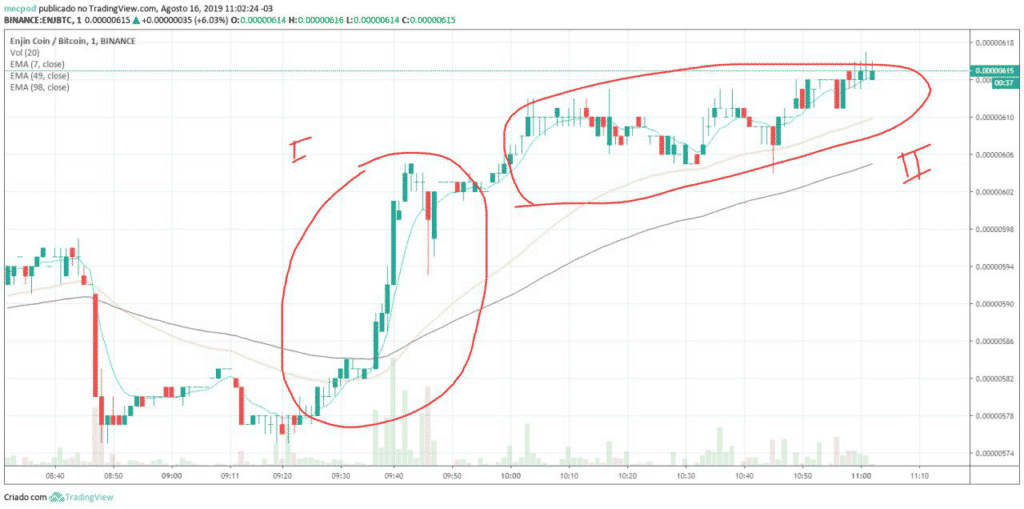
TREND is different from BOOM. As the data construction is off, the support and resistance levels. Thus, it alerts users of the price movements in a contiguous fashion. Where BOOM tracks mainly strong price movements in price & volume. TREND tracks the overall up-trending movement. In some cases, the moves can be caught by both Bots. A good example to show the differences is the chart provided on their Site above.
USDT
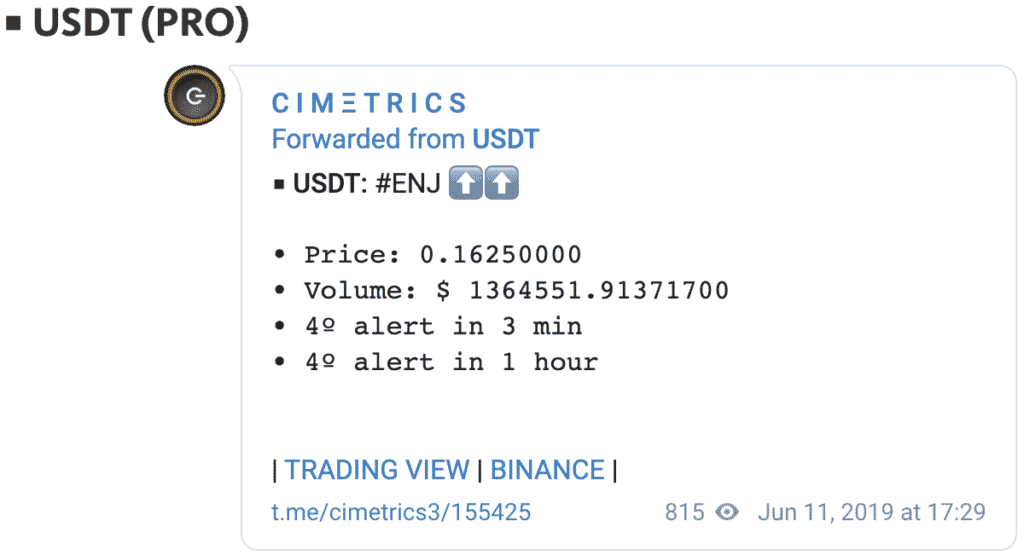
This one is not one I would not expect them to have done but here they give trend metrics for those interested in trading the USDT markets.
SPIKE
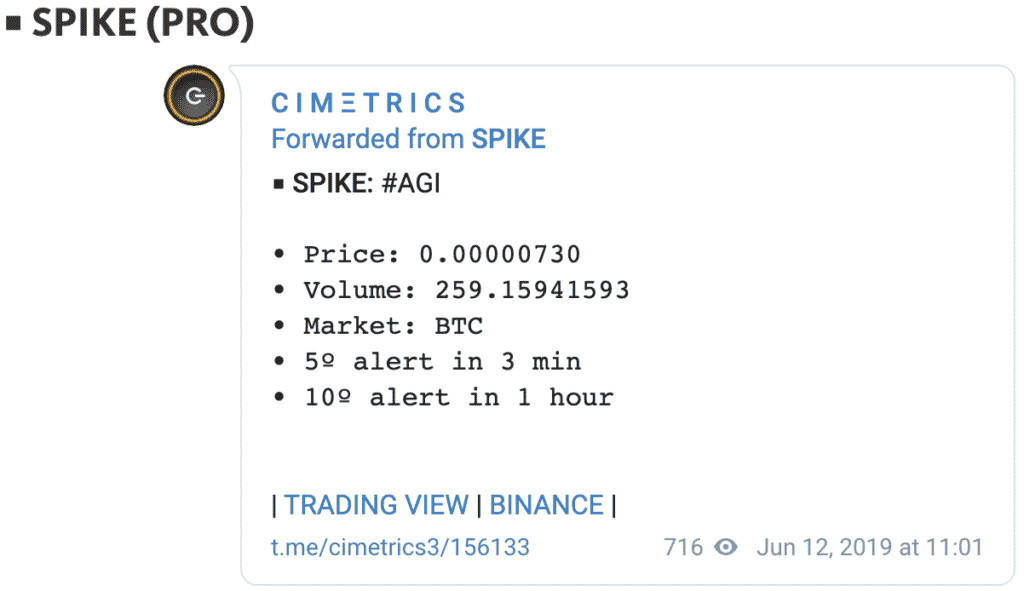
BOOM BOOM SPIKE!
Where BOOM constantly alerts to strong/short moves, SPIKE just alerts to specific points. So if the price of a cryptocurrency pair suddenly spikes, well, you will get an alert. Because of the shorter span, it will catch the move often before BOOM does. We find it to be very complimentary in its use.
LOW
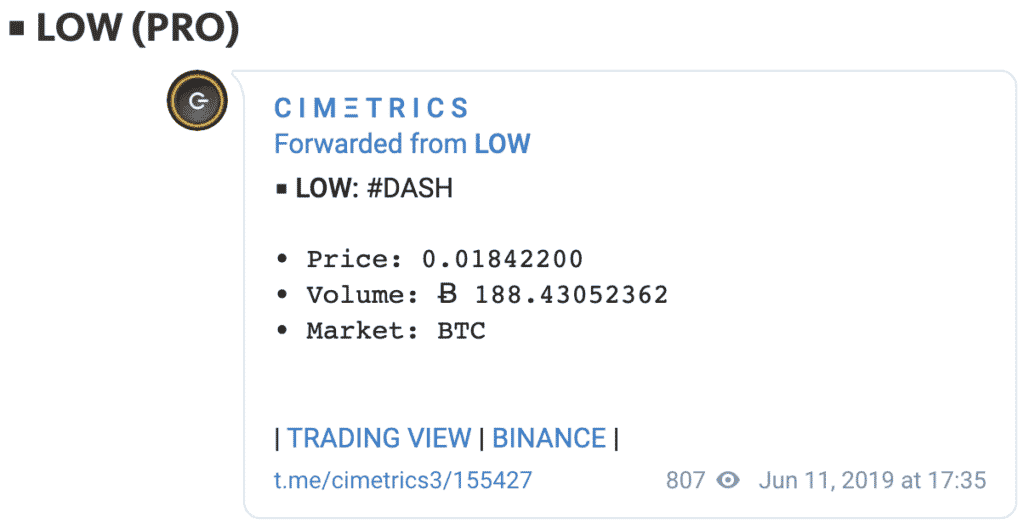
BUY THE F*CKING DIP! BTFD is a tried and true calling for all HODL traders. So this indicator is perfect for those looking to buy their favorite altcoin with dips. Think of it as a DIP radar that I know many traders love to trade this way. Mainly for their HODL portfolios.
BITSUNAMI
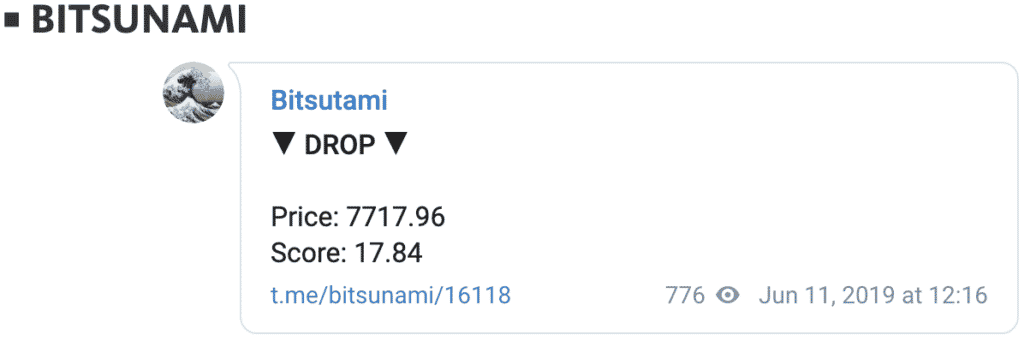
This aptly named indicator for the BTC-USDT market alerts when a HUGE MOVE comes our way. They say it is either for protecting user funds or for creating scalping opportunities. Really, imo it is just for big BTC moves.
VOLUMETER
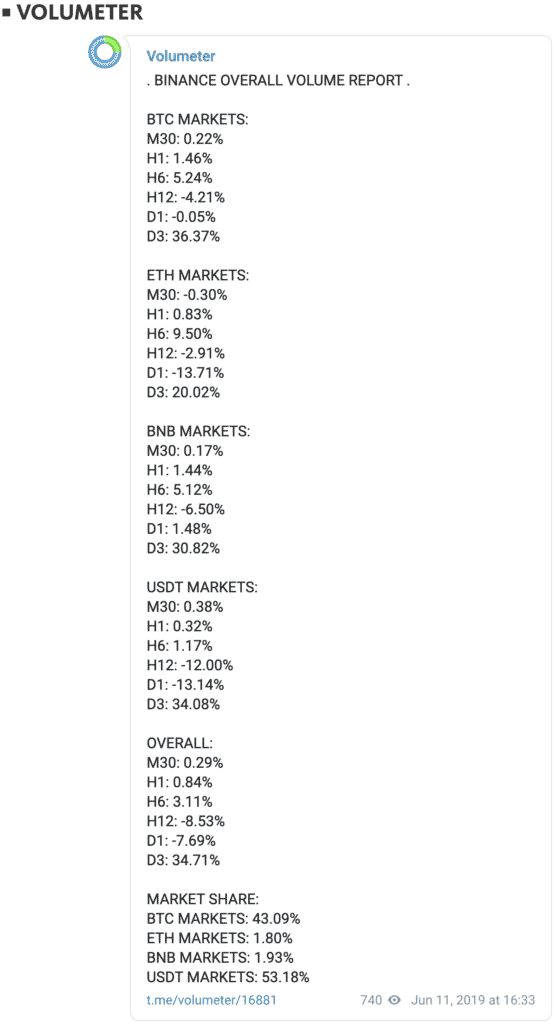
VOLUMETER imo is the least useful of their tools. It is nice they think to include this for some. A better representation of the above, they have included to make it more palatable for users in a graphical format. Which this type of data is better for users to view/understand.
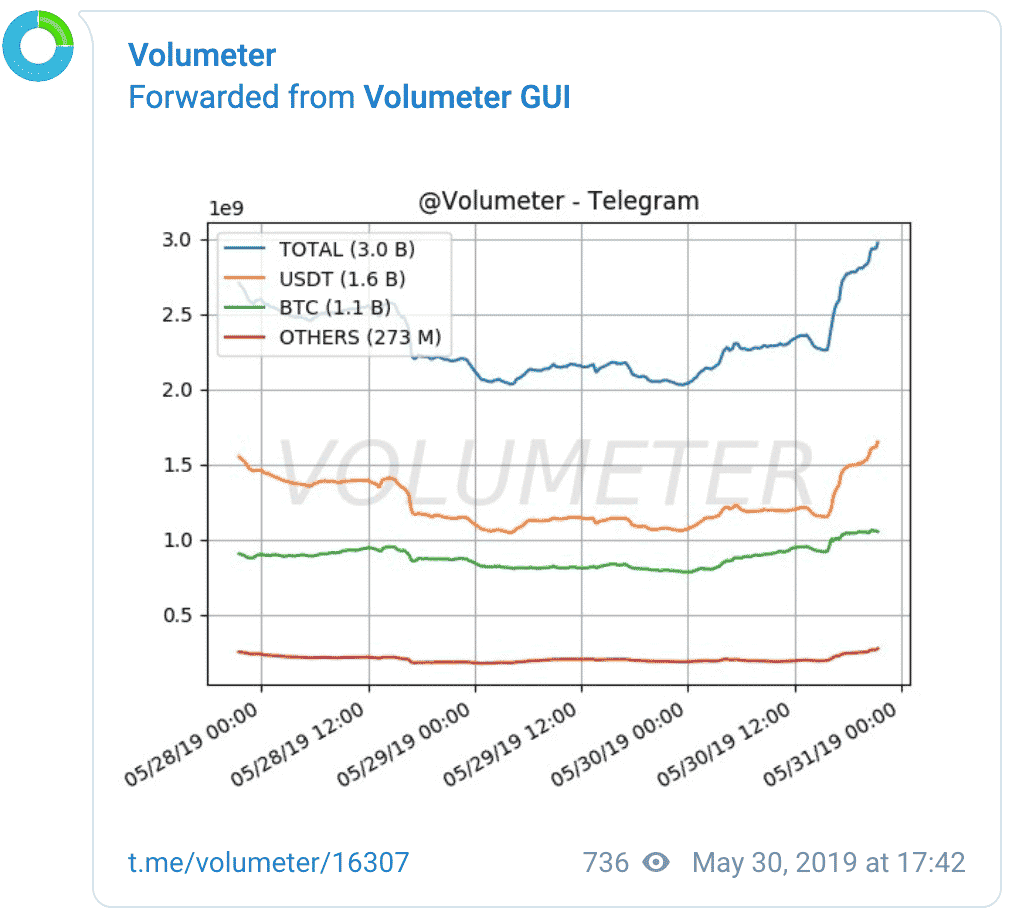
VOLUMETER GUI Pro, imo, is more useful for showing the VOLUMETER data. The basic idea is to gauge the volume of BTC to USDT. Flowing in and out of the markets, with, say, ALTCOINS. When BTC goes flat, volume often picks up elsewhere, such as in the Altcoin market. A nice addition to their suite of tools.
Final Thoughts…
CIMETRICS' first 4 tools, imo, are the most useful in combination. As a chart watcher, I would use this mostly for ALERTS. That is its primary function imo. Most people are not going to spend their time futzing around with Telegram to display data this way. It is just too cumbersome for most.
There is a die-hard audience that loves data; those same people are likely also using DOS from the 80s. Or they are programmers and have a built-in # textual focus for data inputs. That is fine, as GUI-based data fails in SPEED. Any good programmer will tell you the simplest value for data = the quickest. I think most people should give each channel a try. Thus, you can see if any of them can be found useful for you. As this tool took plenty of time for the programmers to script. Especially since these guys are die-hard traders and deserve some love 🙂
CIMETRICS is data, pure and simple, using Binance and Telegram as its endpoints, as they call them. Give it a try and see if you like viewing stats this way. If it helps you get more trades or increase your trading profits. I think it will for many, but they have to understand that this is not magic. Nobody is going to give you winning magical trades. You have to learn to trade using many data sets, not just a few charts or indicators. Until next time, Enjoy!