

This post is also available in:
 Português
Cryptolume is an advanced cryptocurrency market analysis platform that combines technical indicators, market data, and trading alerts into a single dashboard. Whether you actively trade cryptocurrencies or simply want deeper market insights, Cryptolume offers a wide range of tools to help you make better-informed decisions.
Trading cryptocurrencies is different from trading Forex due to the lower overall trading volume. This makes technical analysis more challenging, and considering volume-based data before entering a position can provide an important advantage. Crypto is still a relatively young market and remains susceptible to manipulation.
Volume data and technical indicators can often reveal what is happening behind the scenes, and Cryptolume helps traders identify those signals. However, you might want to find your nerd glasses first.
If you prefer not to spend hours analyzing charts yourself, another option is to follow experienced traders through professional crypto signal groups. These communities provide real-time trade ideas, market analysis, and educational content, allowing you to benefit from expert insights without having to perform every analysis yourself.
What is Cryptolume in a nutshell?
CRYPTOLUME is a smart cryptocurrency analysis tool. CRYPTOLUME helps users make knowledgeable trades and assists with finding fast moving, profitable cryptocurrencies. SAVE HOURS per day looking at volume and price action through the use of a web-application graph and notification system.
So, what you get is the ultimate dashboard for what is going on in the markets. Cryptolume.co is not a tool that spreads signals. It is more of a research tool that helps you find excellent trading opportunities using various indicators. Basically, Cryptolume pulls data from exchanges like Binance, processes it, and visualizes it conveniently. This enables you to get an overview of the markets. All this without having to open 100s of tabs, charts, and order books. Do you want to know where the party is going? And what is being traded right now by the masses? This tool helps to spot where the action is.
Insightful data on the buyer/seller ratio at a glance for 100s of cryptocurrencies is quite useful. When combined with RSI data across several timeframes, it is even better. Furthermore, it provides its formula. Which is based on price action, volume, and RSI.
Presenting you with hints on what is interesting right now. There is an additional Slack channel you can opt in to receive alerts once the indicator triggers. Currently, Cryptolume.co pulls data from the following exchanges: OKX, Binance, Bitfinex, Poloniex, HitBTC, KuCoin.
Let's take a look at several features.
The Dashboard
Let's take a look at XEM, which is pretty depressing at the moment.
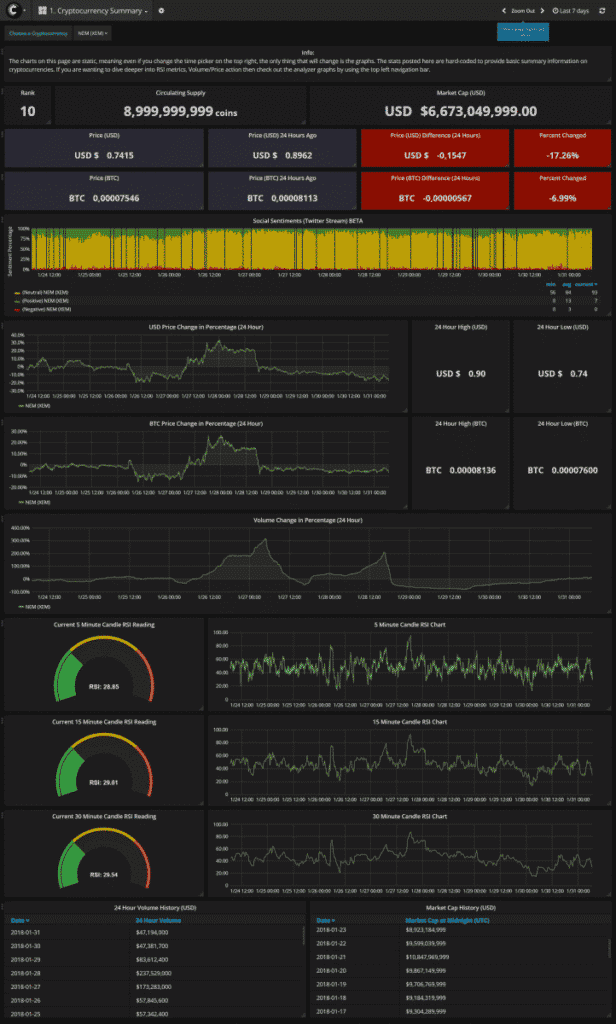
I took it for the last seven days. XEM had a hard time with the hack, as well as the drop in Bitcoin. Let's assume I want to know if it is an appropriate time to buy some at these oversold levels. While the price of XEM might seem to be attractive. We can see that this token's market cap has dropped. We have mostly neutral social sentiment, and the volume history shows that after the sell-off spike, volume plummeted. So I'd interpret it to stay away.
Table of Movement
The movement table is a very cool overview of what is happening in the world of cryptocurrency. With a comprehensive page like this, fed by live data.
You know what is going on, and which coin has momentum right now. At a glance, you have all the percentage movements of coins and tokens concerning volume and price for the 5, 15, 30, and 4-hour timeframe as well as their RSI values,
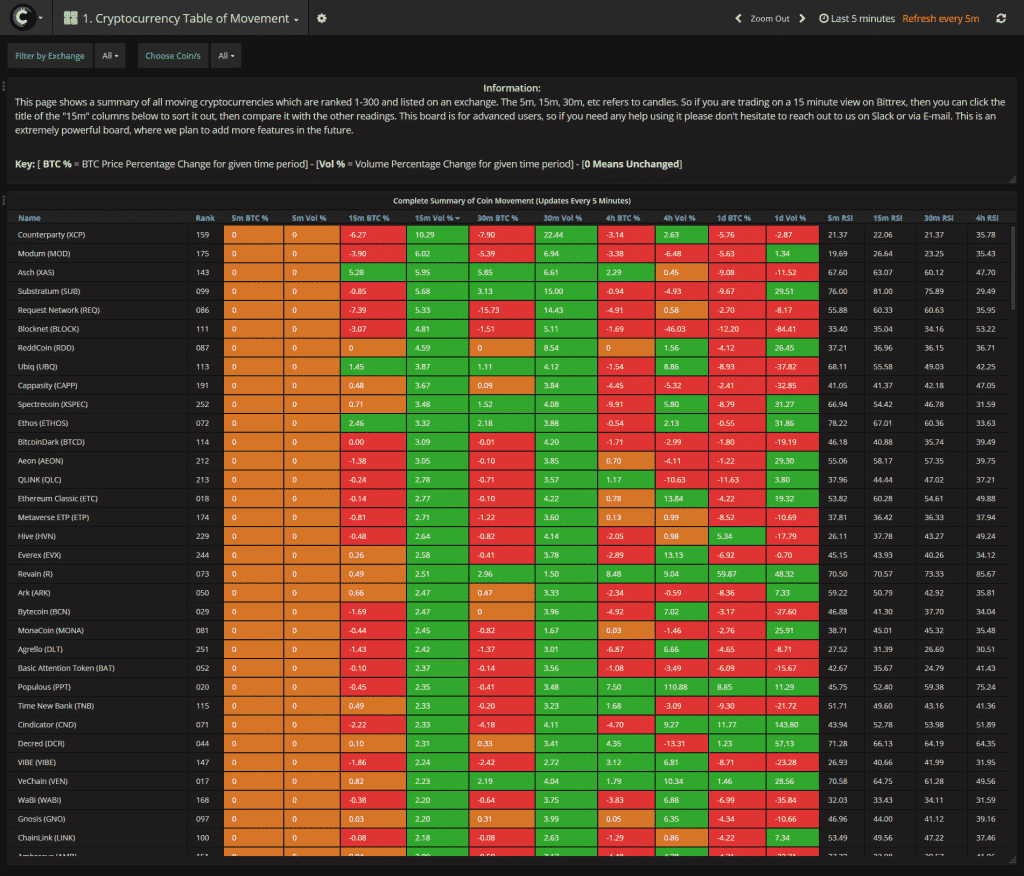
Table of Events
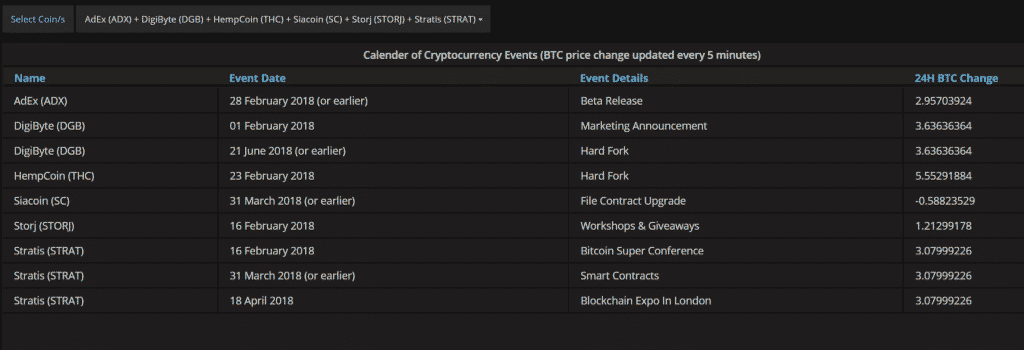
The table of events is a handy tool for fundamental traders. Several crypto calendars feed this page, and it shows upcoming news for multiple cryptocurrencies at a glance. You can select the coins you have put an eye on very conveniently and see what is coming up.
Again, this is a real timesaver. Instead of checking coinmarketcal.com and the likes, you have all the data right at your fingertips. This, along with an additional column showing the recent price change against BTC. This is very helpful to find coins. Ones where the news has not already been priced in. Or to find a cryptocurrency in a dip with juicy news upcoming.
The Buyer/Seller Percentage
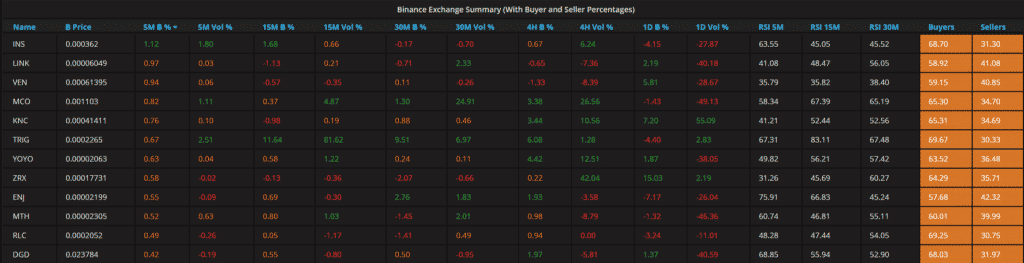
A feature that comes in handy for all the traders who like to consider buy and sell walls. Cryptolume offers buyer/seller pages for several exchanges like Binance, Bitfinex, KuCoin, HitBTC, and Poloniex. If you are more of a numbers guy than a visual one, you will appreciate this feature. You will see the current sentiment of the order book. By doing so, you will be able to estimate your chances better. For example, a support line is likely to hold or not. Another example: The price of a particular coin/token nears your figured support line. You see that the buyer percentage is increasing; it is more likely that this support will hold, and vice versa.
Twitter Sentiments
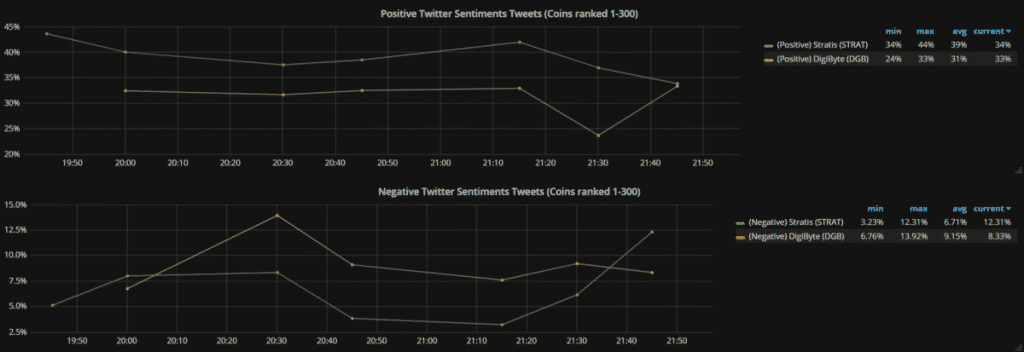
While we would refrain from making any trade decisions directly from this feature. Still, it is a useful tool for checking the current sentiments on Twitter. Trading is always a reflection of mass psychology, and this tool can help you estimate it better.
You can run several coins/tokens against each other to determine which one has more positive hype around. Let's say you have two trades in mind, both with promising TA and other intriguing factors. You could check Twitter sentiment for additional input to get a sense of what's more likely to move faster / more broadly, given the hype factor.
The Twitter sentiment tool is also interesting from another perspective. You can check it against your impression and remove the subjective bias you may have built.
Here is an example of the cryptos with strong communities behind.
The RSI Analyzer
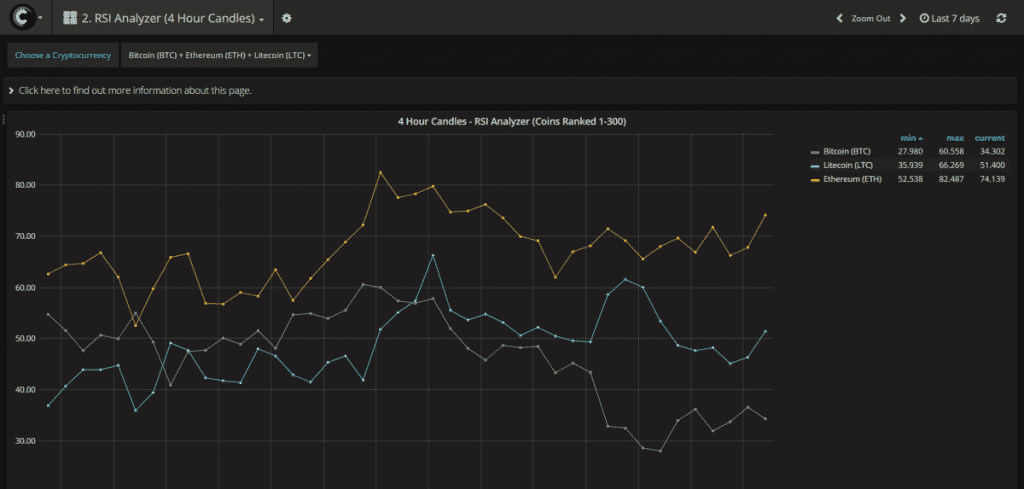
Sure, you have an RSI indicator already on your charts. This is so that you might ask about the purpose of this feature. Again, it comes to correlation here and how to put the cryptos into the big picture. It is very convenient to have several RSIs on a single graph for direct comparison. This can give you interesting insights. For example, how closely the RSI of $xyz ties to BTC, or whether they move in an inverted relationship. Once again, an ultimate time-saver. As you have all the coins with their RSI data for multiple timeframes (5M/15M/30M/4H) at your fingertips.
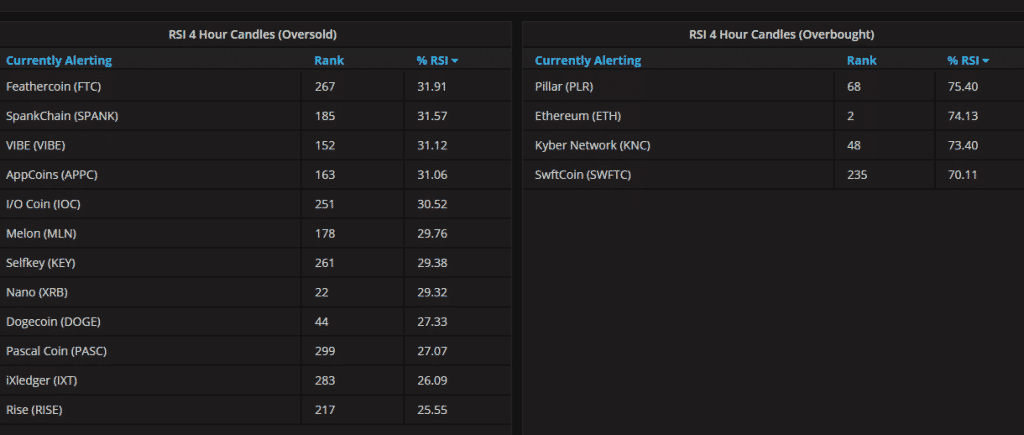
Besides that, there is a handy alerts page for each time frame. Thus uncovering all the oversold/overbought cryptos on the market for you:
The Volume Analyzer
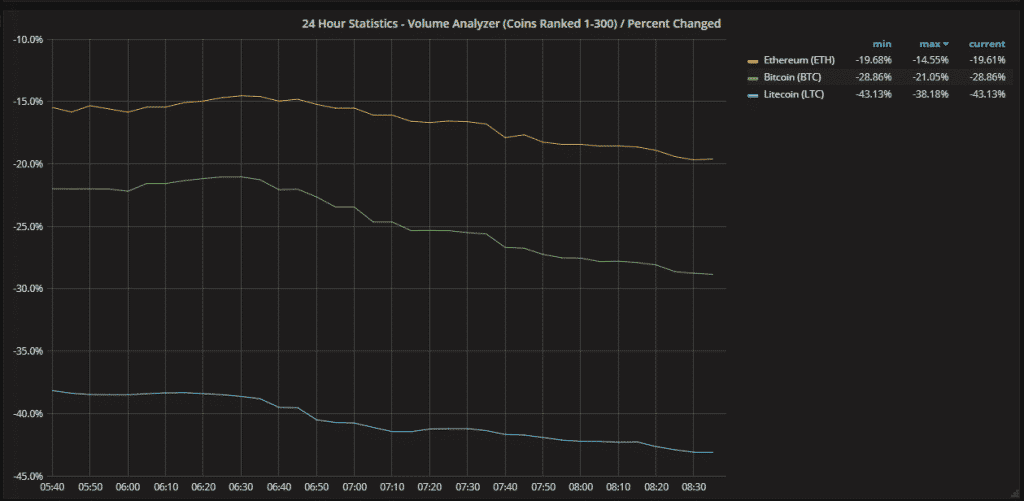
Crypto markets are young; therefore, there is an essential difference between trading FX pairs: the volume. More volume usually means that your technical analysis becomes more reliable. More volume usually means more significant price moves. Volume is that thing you have to keep an eye on when trading cryptos. The volume analyzer helps you with that. You can get historical volume stats on 1H, 1D, and 7D. This way, you can directly compare the volumes of several cryptocurrencies on the graph.
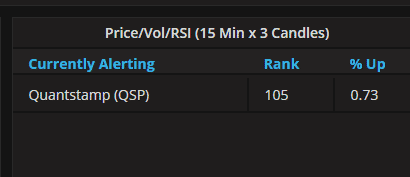
The Volume/Price/RSI Spike alerts
This tool is a nifty one. It spits out alerts off three uptrends in volume/price. Along with the RSI showing at oversold levels on the three candles before the uptrend has started.
In Conclusion…
Cryptolume is a comprehensive tool for the day trader. Maybe even for the investor that likes to plan the perfect entry point. One that has some knowledge in trading. This tool can save you tons of time. Thus, you can see it as your new market scanning assistant. There are many valuable insights to gain, and here lies your opportunity by using Cryptolume.
The data used is compiled in a good logical flow. One can see that the app was developed under the counsel of real, active, and knowledgeable crypto traders. Hence, the price is pretty low for the value you get here: $19 / month. This can make your life as a day trader easier.
If you don't want to hit F5 on the app all the time. Well, there is also an advanced plan for $29. This gives you access to a Slack channel where bots inform you of generated alerts. Along with personal chat support by the admins. Furthermore, they just added a bot-driven notification once new coins enter exchanges.
Right now, an arbitrage scanner has been added. Consequently, we didn't review it here. But it is good to see the team active and continuously adding new features.
However, we also want to stress that Cryptolume might not be for everyone. It is a tool to present data in a convenient, time-saving way for traders who know what they are doing. People who expect a simple signal service. Or those who don't have sufficient trading knowledge won't be satisfied with their purchase. Pro traders will surely enjoy the many convenient features, and at that price, it is a no-brainer.
